
| What is I-TASSER server? |
| How does I-TASSER generate structure and function predictions? |
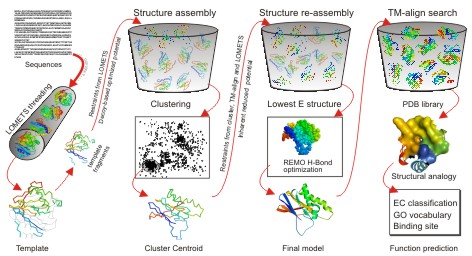
In the second step, the continuous fragments excised from the PDB templates are reassembled into full-length models by replica-exchange Monte Carlo simulations with the threading unaligned regions (mainly loops) built by ab initio modeling. In cases where no appropriate template is identified by LOMETS, I-TASSER will build the whole structures by ab initio modeling. The low free-energy states are identified by SPICKER through clustering the simulation decoys.
In the third step, the fragment assembly simulation is performed again starting from the SPICKER cluster centroids, where the spatial restrains collected from both the LOMETS templates and the PDB structures by TM-align are used to guide the simulations. The purpose of the second iteration is to remove the steric clash as well as to refine the global topology of the cluster centroids. The decoys generated in the second simulations are then clustered and the lowest energy structures are selected. The final full-atomic models are obtained by REMO which builds the atomic details from the selected I-TASSER decoys through the optimization of the hydrogen-bonding network (see Figure 1).

For predicting the biological function of the protein (the last column at Figure 1), the I-TASSER server matches the predicted 3D models to the proteins in 3 independent libraries which consist of proteins of known enzyme classification (EC) number, gene ontology (GO) vocabulary, and ligand-binding sites. The final results of function predictions are deduced from the consensus of top structural matches with the function scores calculated based on the confidence score of the I-TASSER structural models, the structural similarity between model and templates as evaluated by TM-score, and the sequence identity in the structurally aligned regions.
| What are the performances of I-TASSER server compared with other methods? |
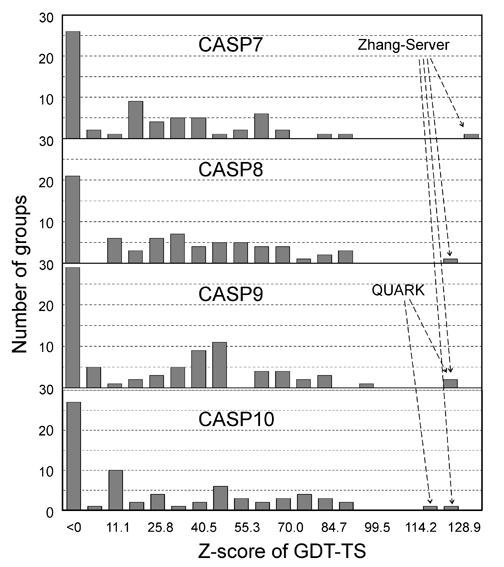
The I-TASSER server (as "Zhang-Server") participated in the Server Section of 7th (2006), 8th (2008), 9th (2010), and 10th CASPs (2012), and was ranked as the No 1 server in CASP7 and CASP8. In CASP9 and CASP10, I-TASSER server and QUARK (another server from our lab) were ranked as No 1 and No 2 servers, respectively. The detailed rank results can be seen here for CASP7, CASP8, CASP9, and CASP10. Figure 2 shows histograms of the Z-score of GDT-TS scores of all servers in CASP7 (68 servers), CASP8 (72 servers), CASP9 (81 servers), and CASP9 (72 servers).

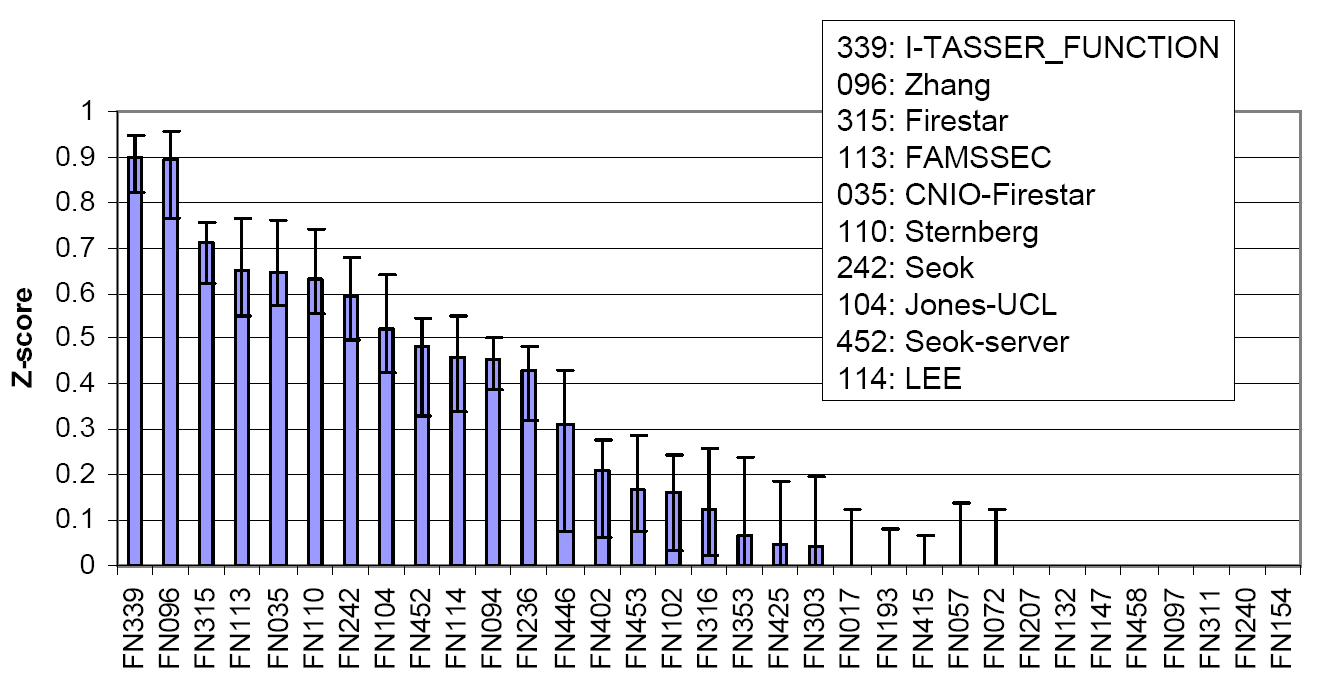
Figure 3 is a summary of COFACTOR, a component of I-TASSER server, in the function prediction section of CASP9, where COFACTOR was registered as "I-TASSER_FUNCTION" and "Zhang" in the server and human prediction sections, respectively. The picture was taken from the presentation by the CASP9 assessor Dr. T Schwede, see http://predictioncenter.org/casp9/doc/presentations/CASP9_FN.pdf.

| What are the output of the I-TASSER server if you submit a seqeunce? |
| How to interpret the output data generated by the I-TASSER server? |
I-TASSER modeling starts from the structure templates identified by LOMETS from the PDB library. LOMETS is a meta-server threading approach containing multiple threading programs, where each program can generate tens of thousands of templates. I-TASSER only uses the templates of the highest significance in the threading alignments, which are measured by the Z-score (the difference between the raw and average scores in the unit of standard deviation). The top 10 templates are the 10 templates selected from the LOMETS threading programs. Usually, one (or two) template of the highest Z-score is selected from each threading program, where the threading programs are sorted by the average performance in the large-scale benchmark test experiments.
For each target, I-TASSER simulations generate tens of thousands conformations (called decoys). To select the final models, I-TASSER uses SPICKER program to cluster all the decoys based on the pair-wise structure similarity, and report up to five models which corresponds to the five largest structure clusters. In Monte Carlo theory, the largest clusters correspond to the states of the largest partition function (or lowest free energy) and therefore have the highest confidence. The confidence of each model is quantitatively measured by C-score (see below). Since the top 5 models are ranked by the cluster size, it is possible that the lower-rank models have a higher C-score. Although the first model has a higher C-score and a better quality in most cases, it is not unusual that the lower-rank models have a better quality than the higher-rank models. If the I-TASSER simulations converge, it is possible to have less than 5 clusters generated. This is usually an indication that the models have a good quality because of the converged simulations.
After the structure-assembly simulation, I-TASSER use TM-align program to match the first I-TASSER model to all structures in the PDB library. This section reports the top 10 proteins from the PDB which have the closest structural similarity (i.e. the highest TM-score) to the predicted I-TASSER model. Due to the structural similarity, these proteins often have similar function to the target. However, users are encouraged to use the data in 'Predicted function using COACH' to infer the biological function of the target protein, since COACH has been extensively trained to derive function from multi-source of sequence and structure features which has on average a much higher accuracy than the function annotations derived only from the global structure comparison.
C-score is a confidence score for estimating the quality of predicted models by I-TASSER. It is calculated based on the significance of threading template alignments and the convergence parameters of the structure assembly simulations. C-score is typically in the range of [-5,2], where a C-score of higher value signifies a model with a high confidence and vice-versa.
TM-score is a recently proposed scale for measuring the structural similarity between two structures (see Zhang and Skolnick, Scoring function for automated assessment of protein structure template quality, Proteins, 2004 57: 702-710). The purpose of proposing TM-score is to solve the problem of RMSD which is sensitive to the local error. Because RMSD is an average distance of all residue pairs in two structures, a local error (e.g. a misorientation of the tail) will arise a big RMSD value although the global topology is correct. In TM-score, however, the small distance is weighted stronger than the big distance which makes the score insensitive to the local modeling error. A TM-score >0.5 indicates a model of correct topology and a TM-score<0.17 means a random similarity. These cutoff does not depends on the protein length.
TM-score (or RMSD) is a known standard for measuring structural similarity between two structures which are usually used to measure the accuracy of structure modeling when the native structure is known, while C-score is a metric that I-TASSER developed to estimate the confidence of the modeling. In case where the native structure is not known, it becomes necessary to predict the quality of the modeling prediction, i.e. what is the distance between the predicted model and the native structures? To answer this question, we tried predicted the TM-score and RMSD of the predicted models relative the native structures based on the C-score.
In a benchmark test set of 500 non-homologous proteins, we found that C-score is highly correlated with TM-score and RMSD. Correlation coefficient of C-score of the first model with TM-score to the native structure is 0.91, while the coefficient of C-score with RMSD to the native structure is 0.75. These data lay the base for the reliable prediction of the TM-score and RMSD using C-score. In the output section, I-TASSER only reports the quality prediction (TM-score and RMSD) for the first model, because it was found that the correlation between C-score and TM-score is weak for lower rank models. However, the C-score is listed for all models just for a reference.
We have found that the cluster size is more robust than C-score for ranking the predicted models. The final I-TASSER models are therefore ranked based on cluster size rather than C-score in the output. Nevertheless, the C-score has a strong correlation with the quality of the final models, which has been used to quantitatively estimate the RMSD and TM-score of the final models relative to the native structure. Unfortunately, such strong correlation only occurs for the first predicted model from the largest cluster. Thus, the C-scores of the lower-rank models (i.e., models 2-5) are listed only for reference and a comparison among them is not advised. In other word, even though the lower-rank models may have a higher C-score than the first model in some cases, the first model is on average the most reliable and should be considered if without special reasons (e.g., from biological sense or experimental data).
| How to use known information (e.g. templates and function) to improve I-TASSER modeling? |
If users know some information about the structure of the modeled proteins, the information can be conveniently uploaded to the I-TASSER server. The information can significantly improve the quality of structural and function predictions.
The I-TASSER server currently accepts two types of user-specified restraints:
| Can I exclude some proteins from the I-TASSER template library? |
I-TASSER needs templates to generate high-resolution structure predictions. In general, excluding close templates will decrease the quality of the I-TASSER modeling. However, users can exclude some templates from the I-TASSER template library for some special purposes (e.g. knowning some templates are different from target, or benchmark testing of the current algorithms).
The I-TASSER server accept two ways of template excludings:
The format of the file should be "PDBID:ChainID %Sequence_Identity", e.g.
| How long does it take for I-TASSER to generate the predictions for your protein? |
Currently, the major time consuming part in the I-TASSER protocol is the structural refinement assembly simulations. For those users who want a quicker reponse or those who do not need a refined models, we recommend them to use our LOMETS (meta-server) or MUSTER (single-server fold-recognition). Because these two servers do not attempt to refine the threading models, the response time is faster than the I-TASSER server.
| What is new? |
| How to cite I-TASSER |
| Funding support |
| Contact information |
zhanglab![]() zhanggroup.org
| +65-6601-1241 | Computing 1, 13 Computing Drive, Singapore 117417
zhanggroup.org
| +65-6601-1241 | Computing 1, 13 Computing Drive, Singapore 117417