Input Sequence in FASTA format
>Q7L1I2 (89 residues)
ATINFTMENQIHQHGKLVNDKFTRMYFKHVLFEDTFFDECYFEDVTSTDTYFKNCTIEST
IFYNTDLYEHKFINCRFINSTFLEQKEGC
|
Predicted Secondary Structure
| Sequence |
20 40 60 80
| | | |
ATINFTMENQIHQHGKLVNDKFTRMYFKHVLFEDTFFDECYFEDVTSTDTYFKNCTIESTIFYNTDLYEHKFINCRFINSTFLEQKEGC |
|
Prediction | CCCCCCSSCSSSSCCSSSSCSSSCSSSCCSSSSCCSSSSSSSSCCSSCCCSSSCCSSSSSSSSCCCCCCCSSSCCSSSCCSSSCCCCCC |
|
Confidence | 93220020458966199910751027633599532896279967364343886769984087577341347525488634663256899 |
| H:Helix;
S:Strand; C:Coil |
Predicted Solvent Accessibility
| Sequence |
20 40 60 80
| | | |
ATINFTMENQIHQHGKLVNDKFTRMYFKHVLFEDTFFDECYFEDVTSTDTYFKNCTIESTIFYNTDLYEHKFINCRFINSTFLEQKEGC |
|
Prediction | 87353414423155041341404514156040551405504056253451304403144030321304634146041441324455775 |
| Values range from 0 (buried residue)
to 8 (highly exposed residue) |
Predicted Contact, Hydrogen and Distance Map Used in D-I-TASSER simulation
Contact Map
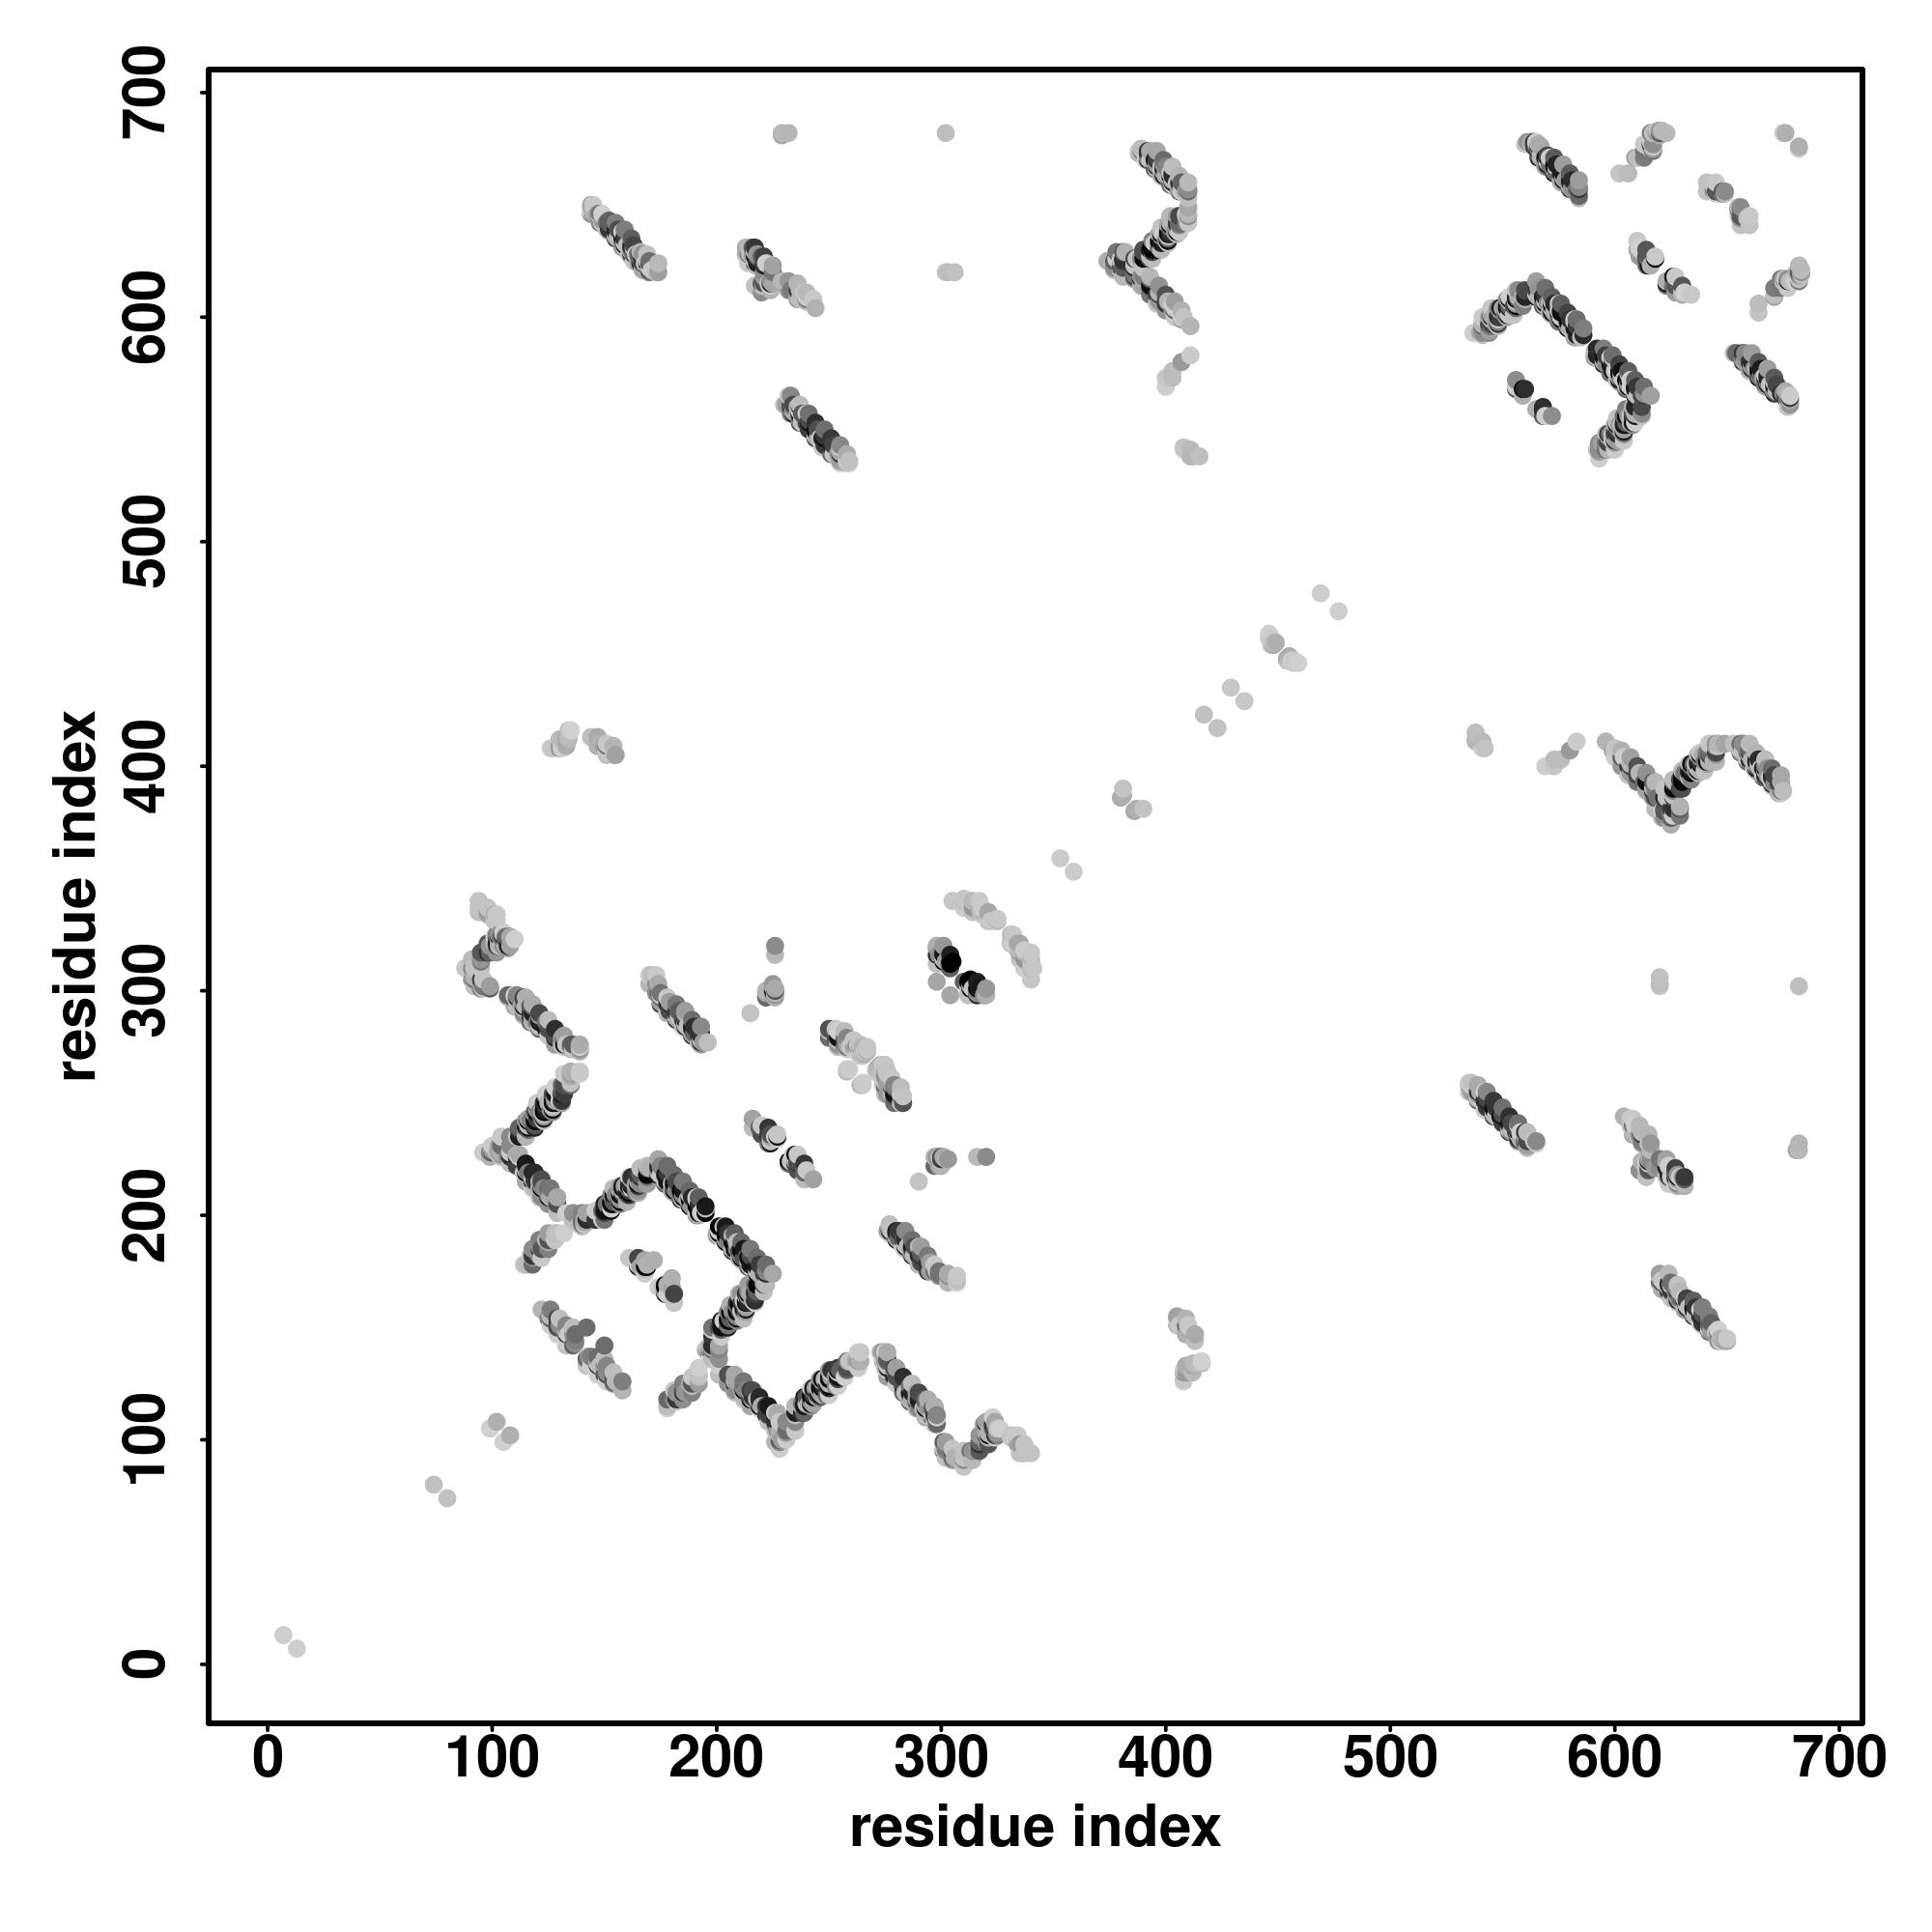
|
Distance Map
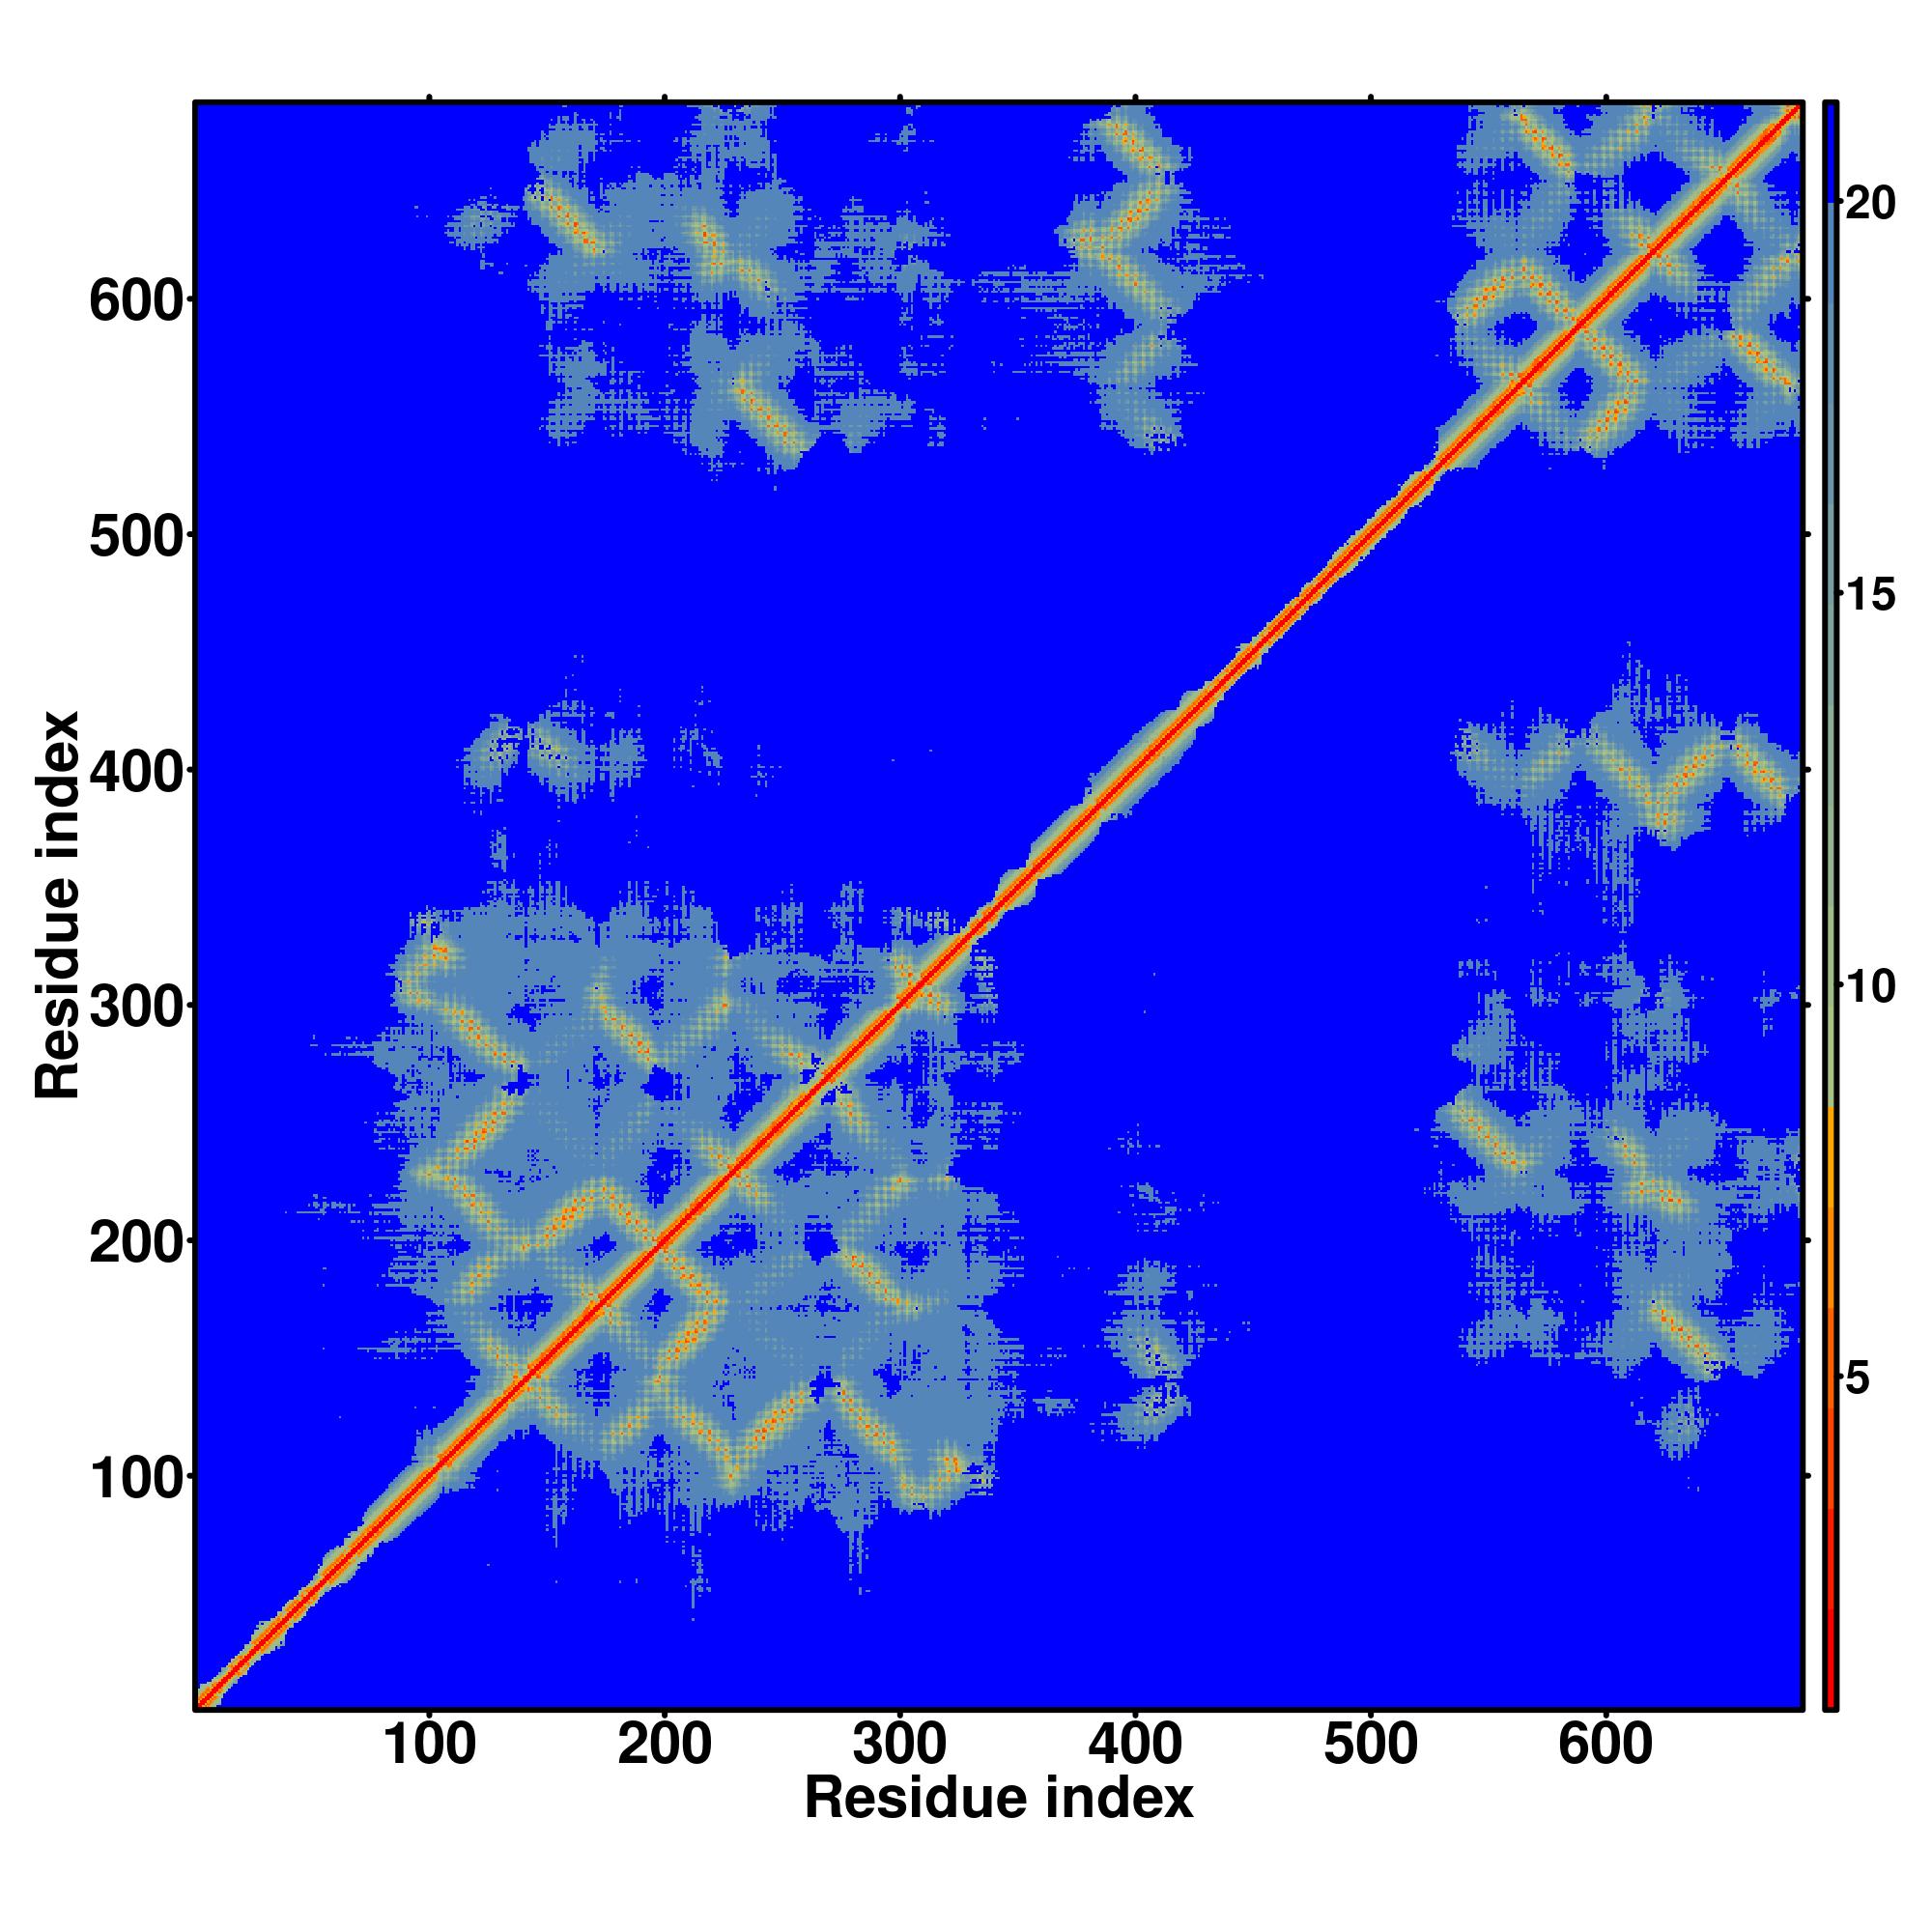
|
Hydrogen bond networks

|
|
| D-I-TASSER simulation is guided by the consensus contact map
(left figure), distance map (middle figure) and Hydrogen bond network (right figure) derived based on confidence scores of
AttentionPotential.
In the contact, distance map and hydrogen bond networks, the axes mark the residue index along the sequence.
For the contact map, each dot represents a residue pair with predicted contact,
while for the distance map and hydrogen bond network, a color scale represents a distance of 1-20+ angstroms or a angle of 0-180 degree.
|
Top 10 threading templates used by D-I-TASSER
| Rank | PDB
hit | ID1 | ID2 | Cov | Norm.
Zscore | Download
alignment | | 20 40 60 80
| | | | |
|---|
| SS
Seq | CCCCCCSSCSSSSCCSSSSCSSSCSSSCCSSSSCCSSSSSSSSCCSSCCCSSSCCSSSSSSSSCCCCCCCSSSCCSSSCCSSSCCCCCC
ATINFTMENQIHQHGKLVNDKFTRMYFKHVLFEDTFFDECYFEDVTSTDTYFKNCTIESTIFYNTDLYEHKFINCRFINSTFLEQKEGC |
|---|
| 1 | 6flsA | 0.16 | 0.16 | 5.25 | 1.50 | DEthreader | | FDFKSEINTSIFENCTFLDCSFEGASFVDVVFQNCNLSNSNFTDAYFERCQFIACKCVGVNMIDTIFKQTSMQRSNFQYSYFDKAKKKF |
| 2 | 6zt4A1 | 0.12 | 0.11 | 3.99 | 3.41 | SPARKS-K | | ----TVWADEEFAGRDFRDEDLSRIRTERVVFTECDFSGVDLSESEHHGSAFRNCTFRRSTIWHSTFTNCSLLGSVFTECRIRPVTVEC |
| 3 | 2g0yA | 0.10 | 0.09 | 3.37 | 0.32 | MapAlign | | --TYAQFTNADLTDSNFSEADLRGAVFNGSALIGADLHGADLTNGLAYLTSFKGADLTNAVLTEAIMMRTKFDDAKITGADFSLAV--- |
| 4 | 2g0yA | 0.09 | 0.09 | 3.43 | 0.43 | CEthreader | | SLTYAQFTNADLTDSNFSEADLRGAVFNGSALIGADLHGADLTNGLAYLTSFKGADLTNAVLTEAIMMRTKFDDAKITGADFSLAVLDV |
| 5 | 4jraC | 0.49 | 0.46 | 13.37 | 2.98 | MUSTER | | ANFTITMENQIHTGMEYDNGRFIGVKFKSVTFKDSVFKSCTFEDVTSVNTYFKNCTFIDTVFDNTDFEPYKFIDSEFKNCSFF------ |
| 6 | 2w7zB1 | 0.15 | 0.15 | 4.92 | 1.51 | HHsearch | | LEDEAILENHLYQQIDLPNQEVRNLVFRDAVFDHLSLANGQFASFDCSNVRFEACDFSNVEWLSGSFHRVTFLRCNLTGTNFADSYL-- |
| 7 | 4jraC | 0.50 | 0.46 | 13.36 | 1.12 | FFAS-3D | | ANFTITMENQIHTGMEYDNGRFIGVKFKSVTFKDSVFKSCTFEDVTSVNTYFKNCTFIDTVFDNTDFEPYKFIDSEFKNCSF------- |
| 8 | 5js4A4 | 0.15 | 0.15 | 4.94 | 0.83 | EigenThreader | | TLINQIVVKQALVGFNFTNAWLYYSAYCEDVSTTGTFHNIYFQLGDIFDRDVHGCDFDNIIFESMNGGIRTVAHCGFGKFWCELKTATS |
| 9 | 2w7zA | 0.19 | 0.19 | 6.16 | 4.85 | CNFpred | | EVRNLVFRDAVFDHLSLANGQFASFDCSNVRFEACDFSNVEWLSGSFHRVTFLRCNLTGTNFADSYLMDCLFEDCMADYASFRFANFNL |
| 10 | 3du1X | 0.06 | 0.06 | 2.52 | 1.50 | DEthreader | | TRLEANLIKASLCGANLNSANLSRCLLFQADLRRTDLGYVLLTGADLSYADLRAASLHHANLDGAKLCRANFGAADLSGASLQGADDTG |
| (a) | ID1 is the number of template residues identical to query divided by number of aligned residues. |
| (b) | ID2 is the number of template residues identical to query divided by query sequence length. |
| (c) | Cov is equal the number of aligned template residues divided by query sequence length. |
| (d) | Norm. Zscore is the normalized Z-score of the threading alignments. A Normalized Z-score >1 means a good alignment and is highlighted in bold. |
| (e) | Download alignment lists the threading program used to identify the template, and provide the 3D structure of aligned regions of threading templates (threading[1-10].pdb.gz). |
| (f) | Template residues identical to query sequence are highlighted in color. |
|
Top 1 final models from D-I-TASSER
Proteins with similar structure
Predicted Gene Ontology (GO) Terms

|
| Download full result of the above consensus prediction. |
| Click the graph to show a high resolution version. |
| (a) | CscoreGO is the confidence score of predicted GO terms. CscoreGO values range in between [0-1]; where a higher value indicates a better confidence in predicting the function using the template. |
| (b) | The graph shows the predicted terms within the Gene Ontology hierachy for Molecular Function. Confidently predicted terms are color coded by CscoreGO: |
| | [0.4,0.5) | [0.5,0.6) | [0.6,0.7) | [0.7,0.8) | [0.8,0.9) | [0.9,1.0] |
|
|

|
| Download full result of the above consensus prediction. |
| Click the graph to show a high resolution version. |
| (a) | CscoreGO is the confidence score of predicted GO terms. CscoreGO values range in between [0-1]; where a higher value indicates a better confidence in predicting the function using the template. |
| (b) | The graph shows the predicted terms within the Gene Ontology hierachy for Biological Process. Confidently predicted terms are color coded by CscoreGO: |
| | [0.4,0.5) | [0.5,0.6) | [0.6,0.7) | [0.7,0.8) | [0.8,0.9) | [0.9,1.0] |
|
|

|
| Download full result of the above consensus prediction. |
| Click the graph to show a high resolution version. |
| (a) | CscoreGO is the confidence score of predicted GO terms. CscoreGO values range in between [0-1]; where a higher value indicates a better confidence in predicting the function using the template. |
| (b) | The graph shows the predicted terms within the Gene Ontology hierachy for Cellular Component. Confidently predicted terms are color coded by CscoreGO: |
| | [0.4,0.5) | [0.5,0.6) | [0.6,0.7) | [0.7,0.8) | [0.8,0.9) | [0.9,1.0] |
|
|
|
Predicted Enzyme Commission (EC) Numbers
Predicted Ligand Binding Sites