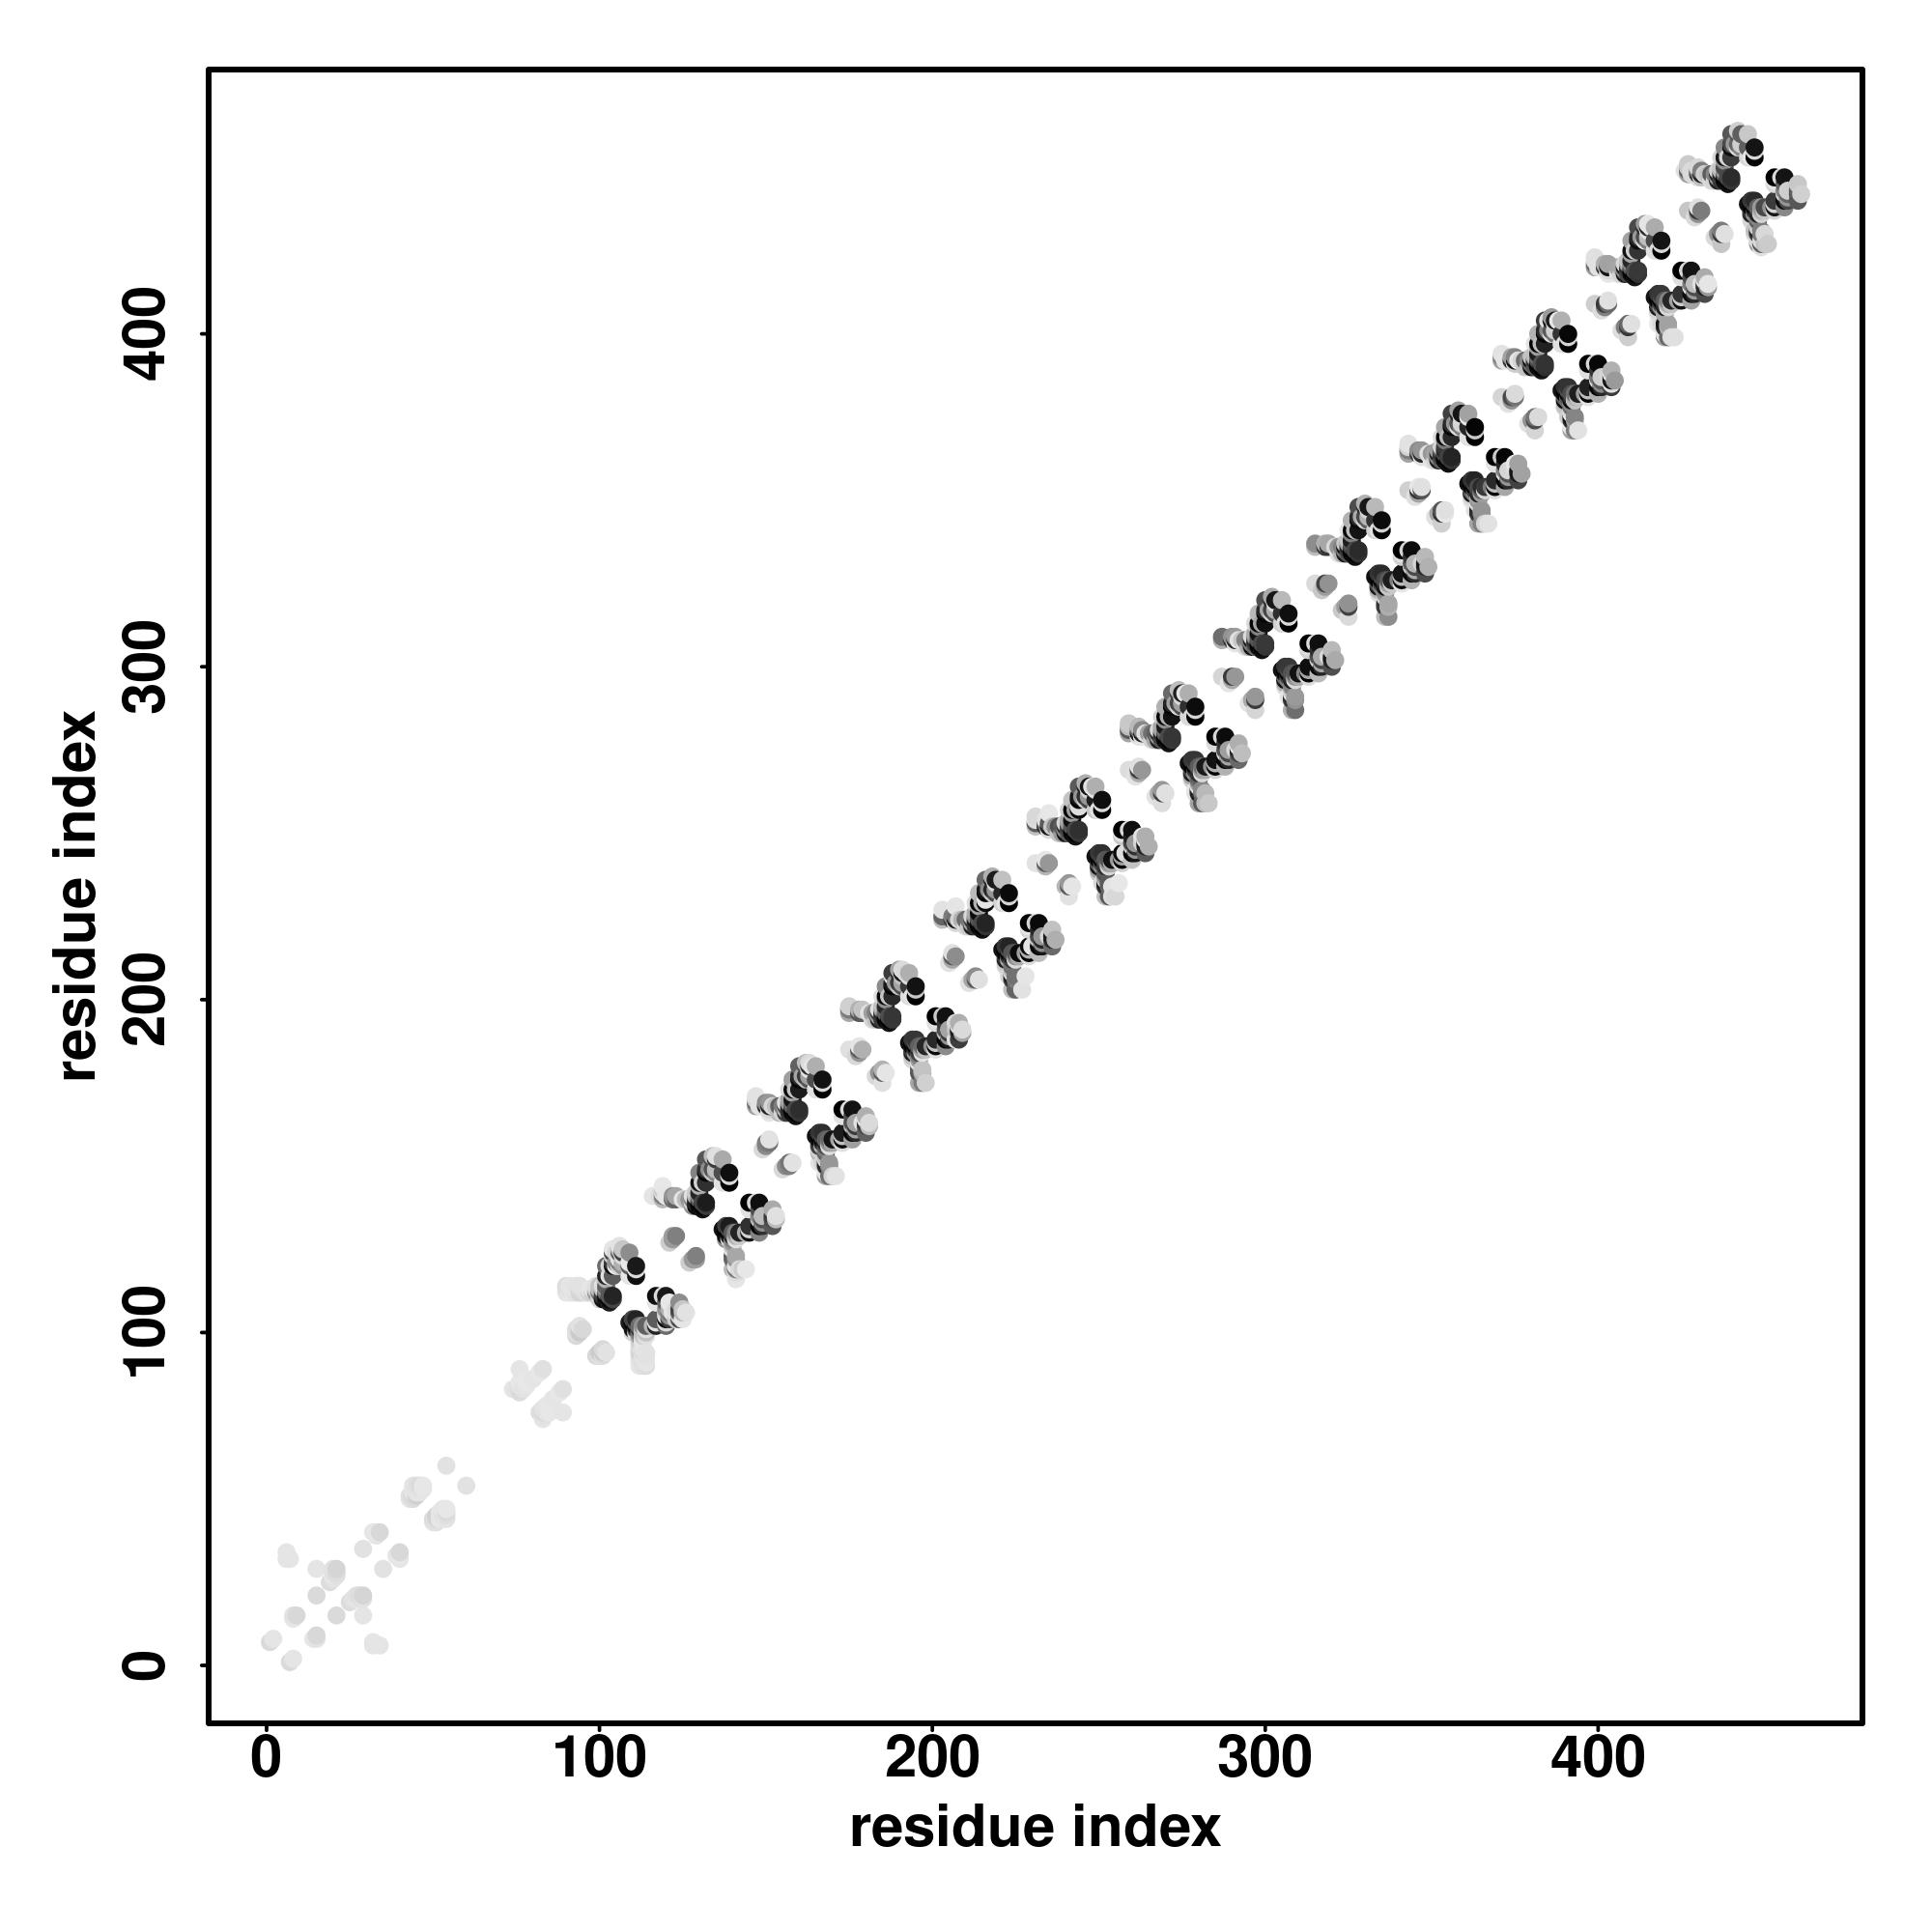
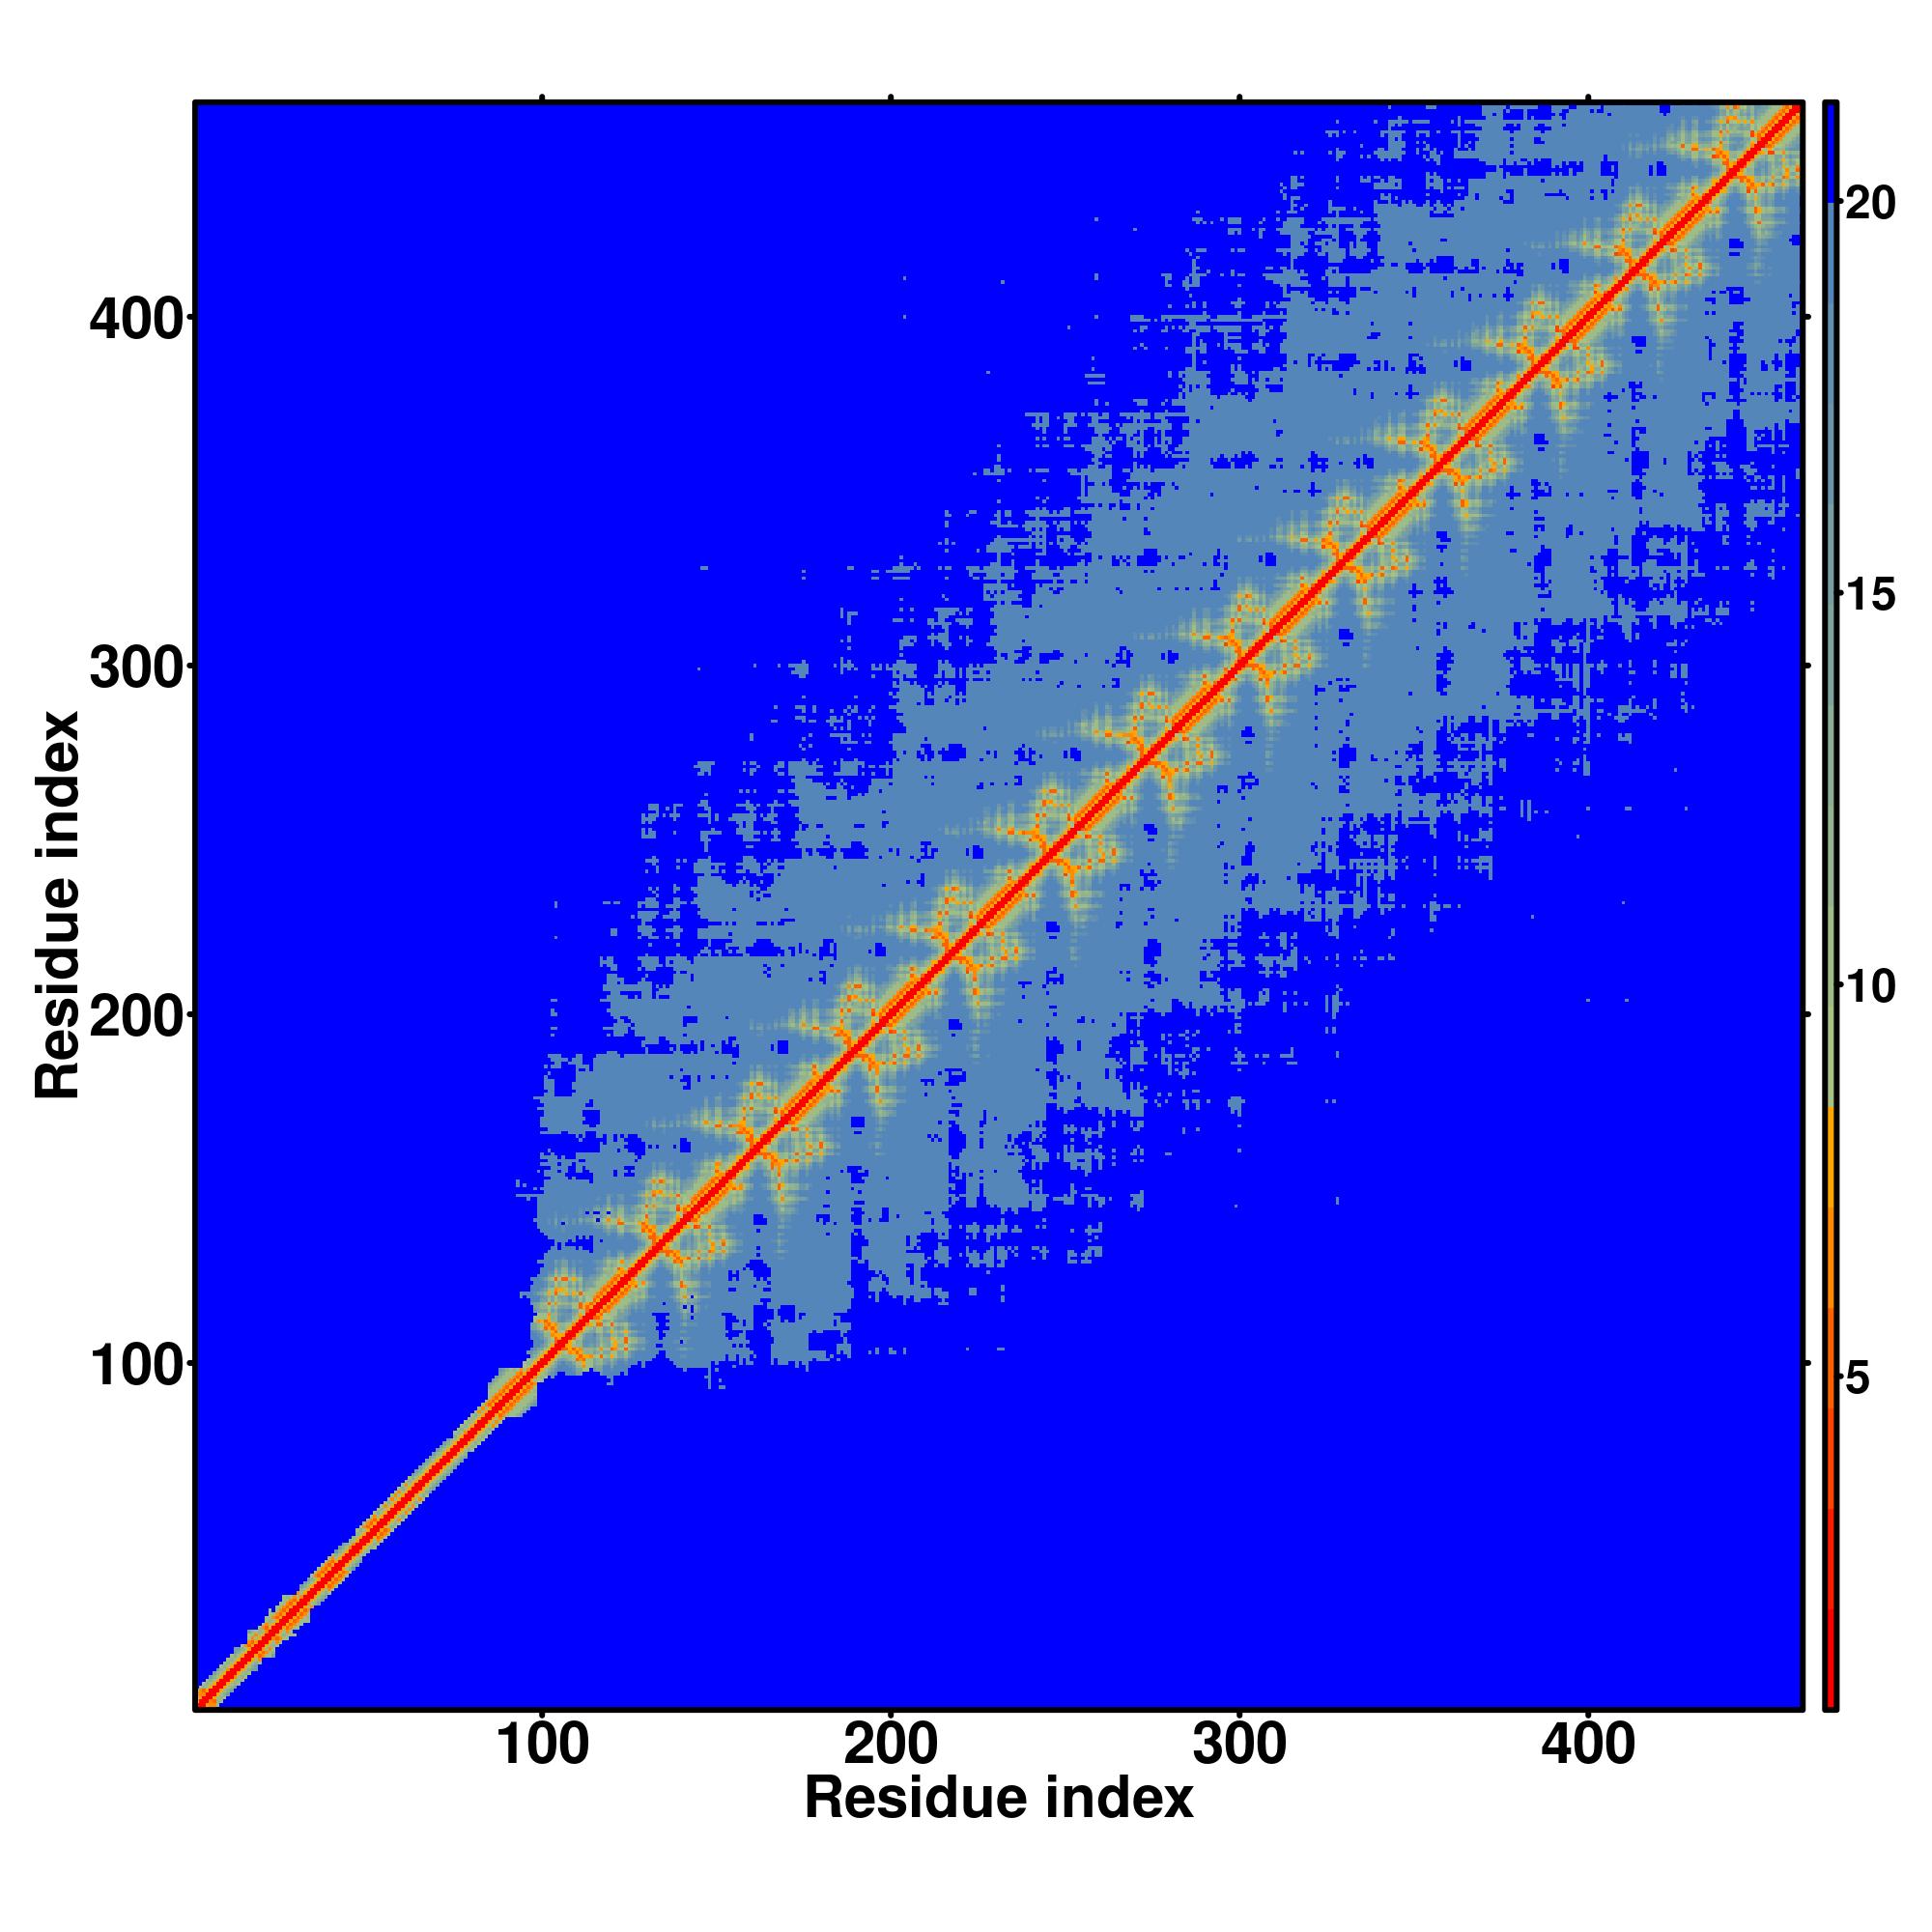
|
Template proteins with similar binding site:
Click
to view | Rank | CscoreLB | PDB
Hit | TM-score | RMSDa | IDENa | Cov. | BS-score | Lig. Name | Download
Complex | Predicted binding site residues |
|---|
| 1 | 0.70 | 1meyF | 0.896 | 0.86 | 0.622 | 0.954 | 1.58 | QNA | complex1.pdb.gz | 10,12,13,14,17,20,21,24,42,45,48,49,52,66,70,73,76,77,80 |
| 2 | 0.68 | 1meyF | 0.896 | 0.86 | 0.622 | 0.954 | 1.43 | UUU | complex2.pdb.gz | 16,19,31,43,44,70,72 |
| 3 | 0.48 | 2jpaA | 0.890 | 0.96 | 0.457 | 0.942 | 1.05 | QNA | complex3.pdb.gz | 3,14,15,16,44,47,59,71,72,76 |
| 4 | 0.34 | 2jp9A | 0.866 | 1.24 | 0.457 | 0.942 | 1.17 | QNA | complex4.pdb.gz | 12,14,17,20,21,24,38,40,41,42,45,49,52,68,70,73,76 |
| 5 | 0.31 | 1tf3A | 0.720 | 2.36 | 0.325 | 0.965 | 1.02 | QNA | complex5.pdb.gz | 23,24,29,38,39,40,41,45,48,49,52,57,67,68,69,73,76,77,79,80 |
| 6 | 0.23 | 2i13A | 0.908 | 1.12 | 0.593 | 1.000 | 0.93 | QNA | complex6.pdb.gz | 10,12,17,20,21,24,38,40,42,45,49,52,70,73,77,80 |
| 7 | 0.18 | 1ubdC | 0.876 | 1.06 | 0.439 | 0.954 | 1.09 | QNA | complex7.pdb.gz | 42,43,44,48,72,75 |
| 8 | 0.11 | 2i13B | 0.961 | 0.70 | 0.616 | 1.000 | 1.02 | QNA | complex8.pdb.gz | 10,12,13,14,17,21,24,40,44,45,48,49,52,66,68,70,73,77,80 |
| 9 | 0.06 | 1f2i0 | 0.602 | 1.61 | 0.391 | 0.698 | 1.17 | III | complex9.pdb.gz | 30,31,41,42,46,47,50,54,56 |
| | Click on the radio buttons to visualize predicted binding site and residues. |
| (a) | CscoreLB is the confidence score of predicted binding site. CscoreLB values range in between [0-1]; where a higher score indicates a more reliable ligand-binding site prediction. |
| (b) | BS-score is a measure of local similarity (sequence & structure) between template binding site and predicted binding site in the query structure. Based on large scale benchmarking analysis, we have observed that a BS-score >1 reflects a significant local match between the predicted and template binding site.
| | (c) | TM-score is a measure of global structural similarity between query and template protein. |
| (d) | RMSDa the RMSD between residues that are structurally aligned by TM-align. |
| (e) | IDENa is the percentage sequence identity in the structurally aligned region. |
| (f) | Cov. represents the coverage of global structural alignment and is equal to the number of structurally aligned residues divided by length of the query protein. |
|