Values range from 0 (buried residue)
to 8 (highly exposed residue)
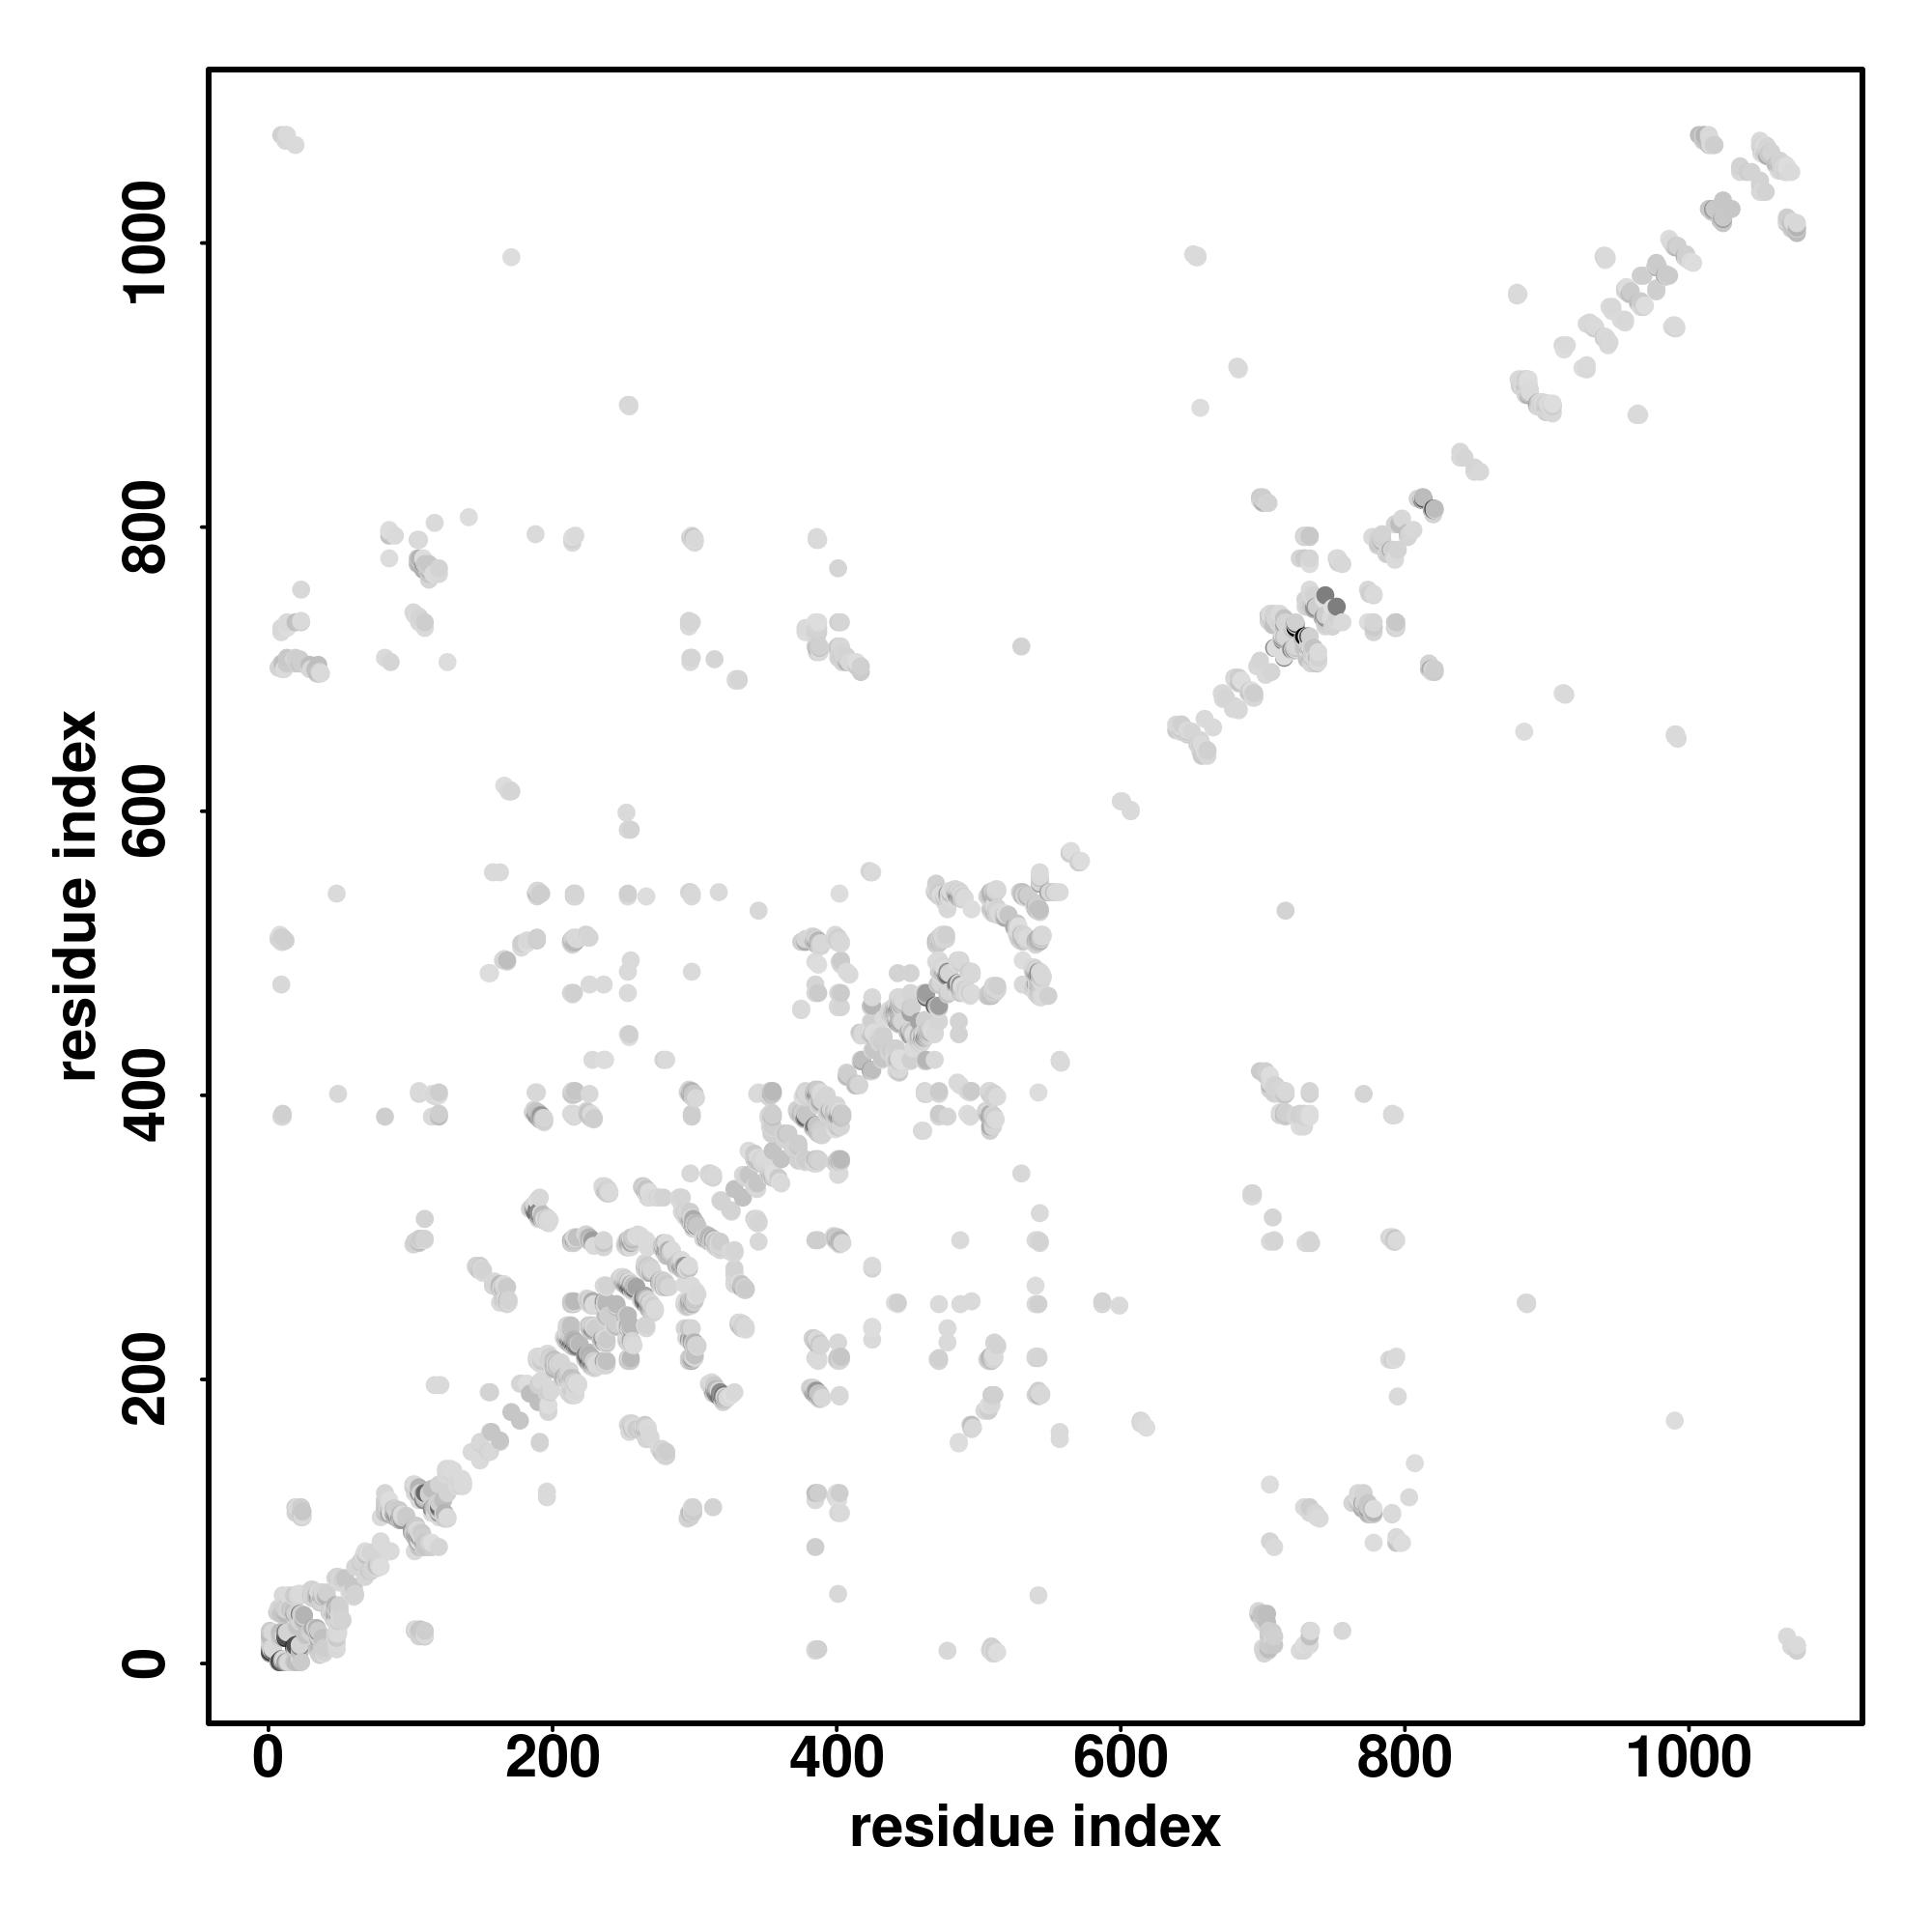
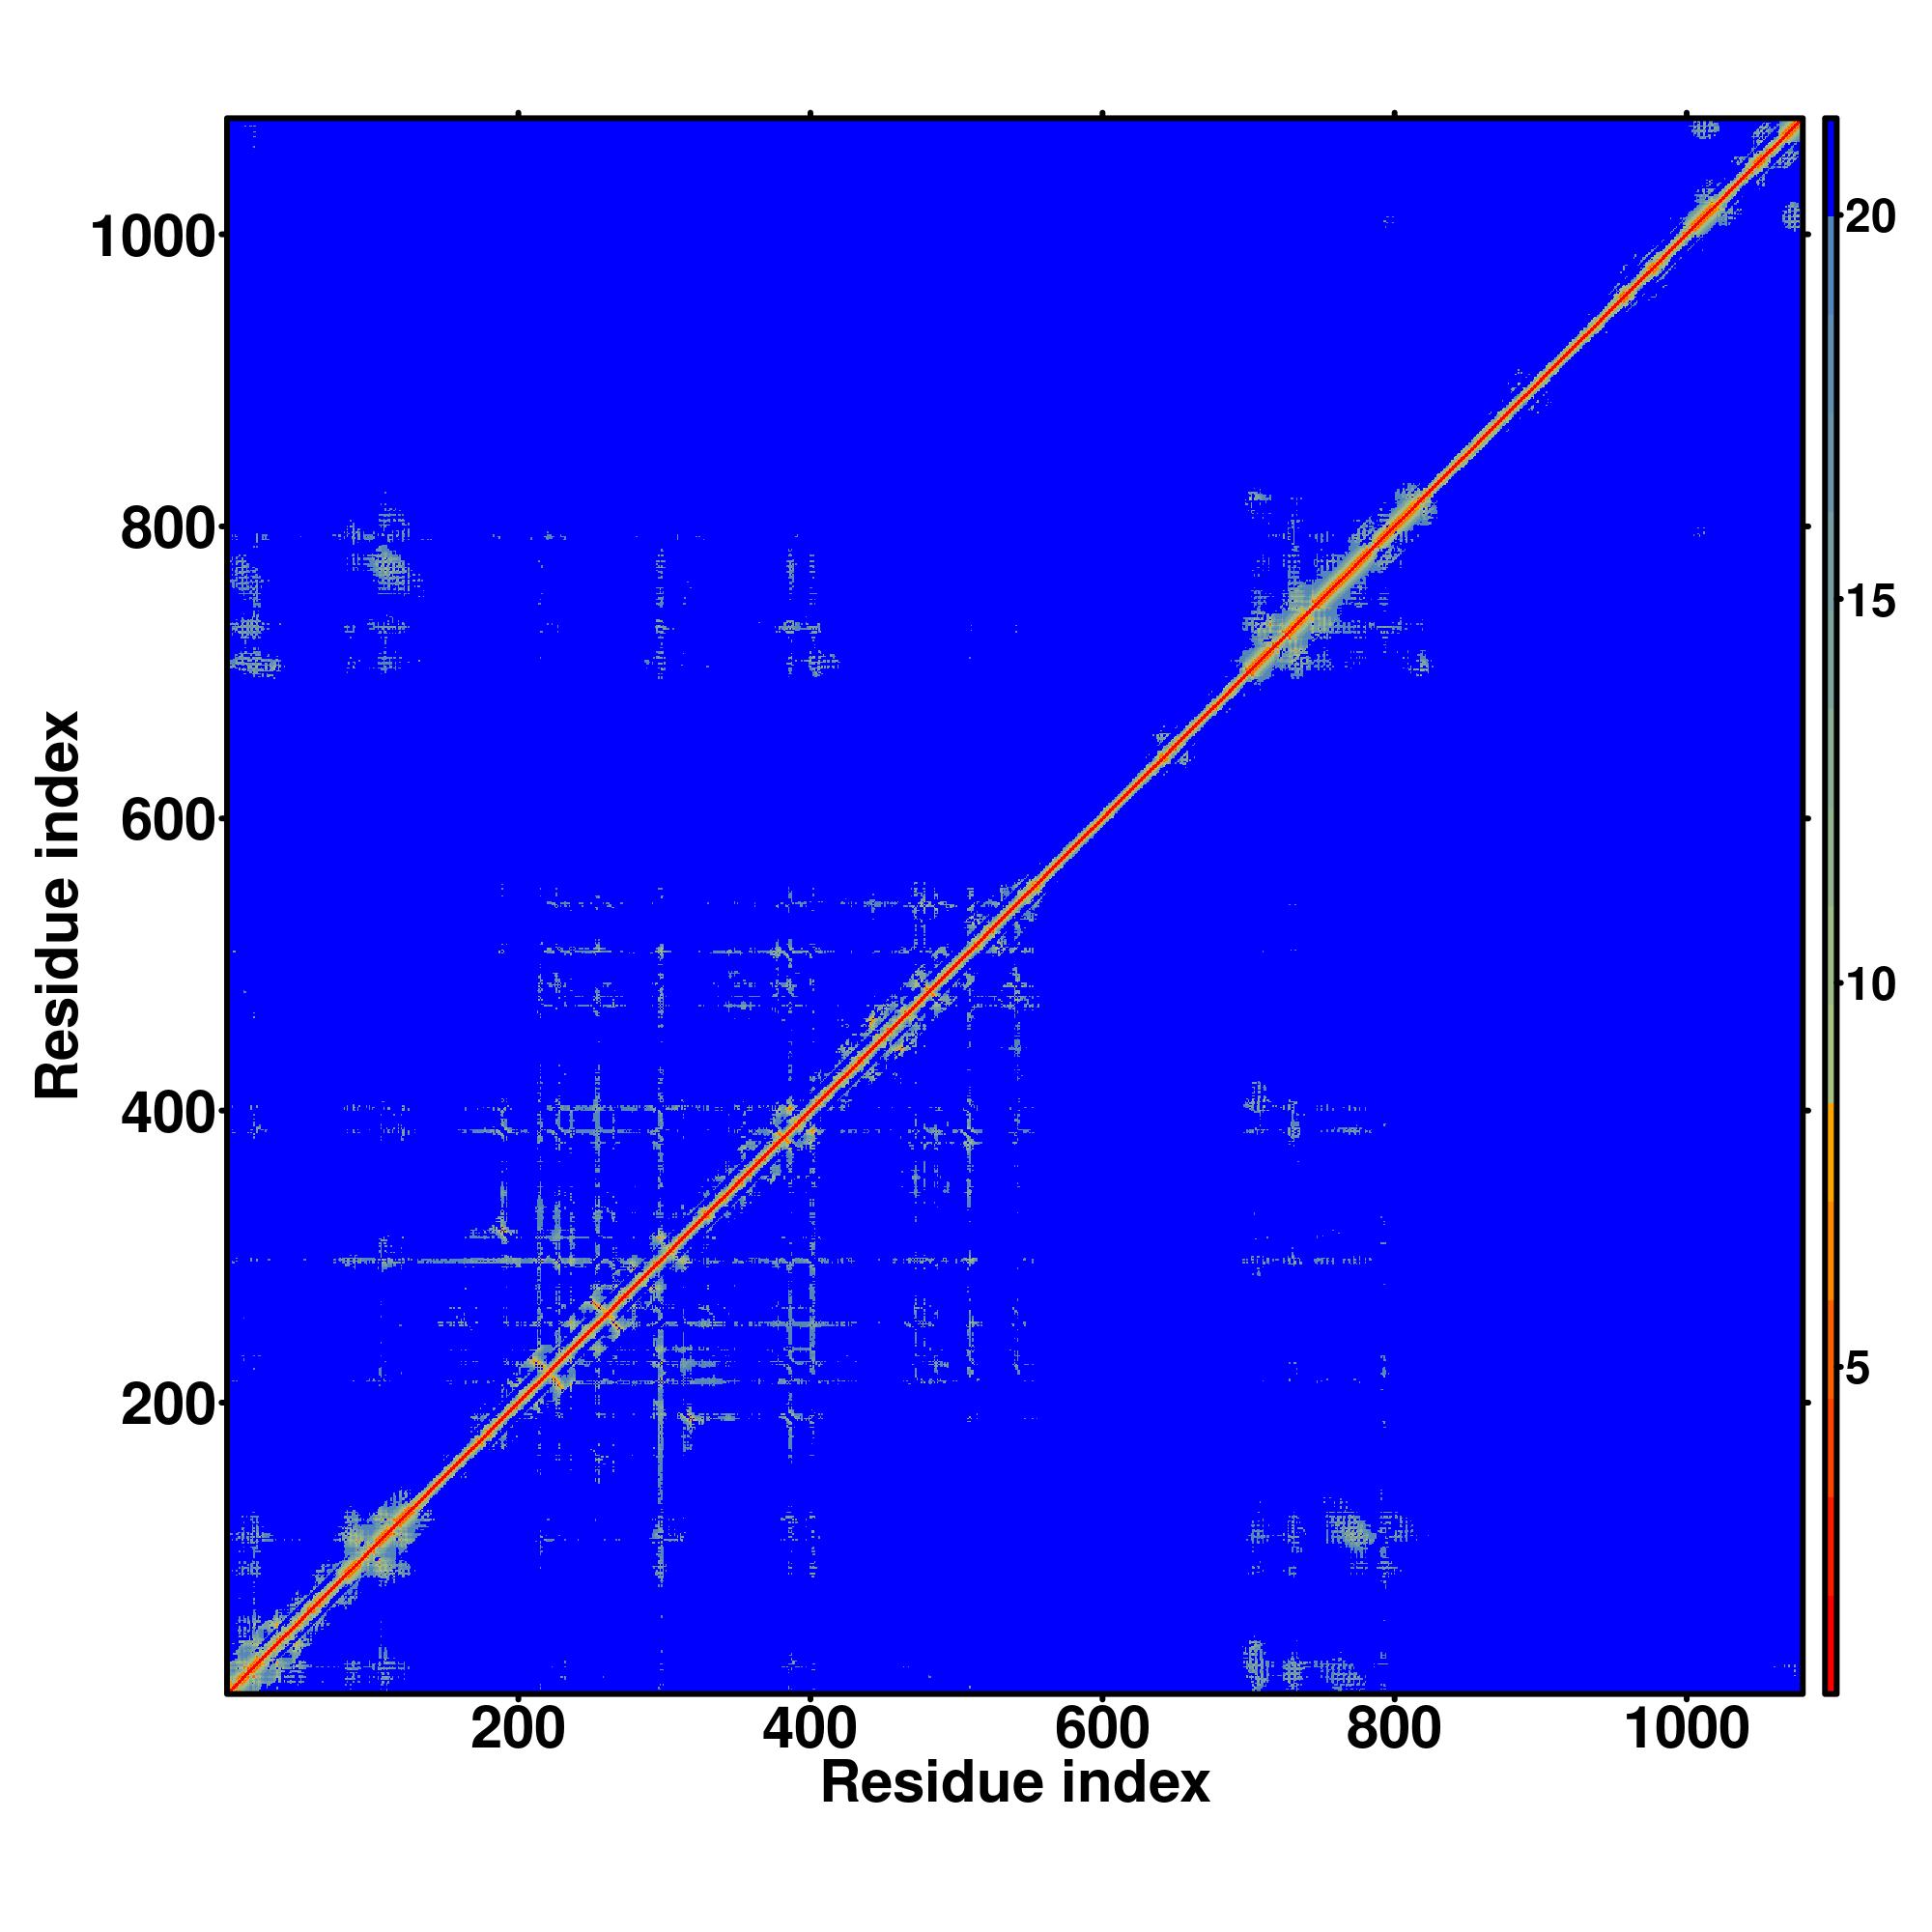
Predicted Contact, Hydrogen and Distance Map Used in D-I-TASSER simulation
Contact Map
Distance Map
Hydrogen bond networks
D-I-TASSER simulation is guided by the consensus contact map
(left figure), distance map (middle figure) and Hydrogen bond network (right figure) derived based on confidence scores of
AttentionPotential.
In the contact, distance map and hydrogen bond networks, the axes mark the residue index along the sequence.
For the contact map, each dot represents a residue pair with predicted contact,
while for the distance map and hydrogen bond network, a color scale represents a distance of 1-20+ angstroms or a angle of 0-180 degree.
ID1 is the number of template residues identical to query divided by number of aligned residues.
(b)
ID2 is the number of template residues identical to query divided by query sequence length.
(c)
Cov is equal the number of aligned template residues divided by query sequence length.
(d)
Norm. Zscore is the normalized Z-score of the threading alignments. A Normalized Z-score >1 means a good alignment and is highlighted in bold.
(e)
Download alignment lists the threading program used to identify the template, and provide the 3D structure of aligned regions of threading templates (threading[1-10].pdb.gz).
(f)
Template residues identical to query sequence are highlighted in color.
D-I-TASSER simulations generate a large ensemble of structural
conformations, i.e. decoys. These decoys are clustered by
SPICKER based on pairwise structure similarity to
report up to five final models from the five largest clusters. Models are
ranked in descending order of cluster size. If the simulations converge
well, it is possible to have less than 5 models generated, which is
usually an indication of good model quality.
(b)
The model confidence is quantitatified by estimated TM-score (eTM-score), calculated based on
significance of threading template alignments, contact map satisfaction rate,
mean absolute error between distance of model and distance of AttentionPotential, and convergence of
D-I-TASSER simulations. eTM-score is typically in the range of [0, 1],
with higher eTM-score signifies higher model confidence.
Query structure is shown in cartoon, while the structural analog is displayed using backbone trace.
(b)
Ranking of proteins is based on TM-score of the structural alignment between the query structure and known structures in the PDB library.
(c)
RMSDa is the RMSD between residues that are structurally aligned by TM-align.
(d)
IDENa is the percentage sequence identity in the structurally aligned region.
(e)
Cov. represents the coverage of the alignment by TM-align and is equal to the number of structurally aligned residues divided by length of the query protein.
Download full result of the above consensus prediction.
Click the graph to show a high resolution version.
(a)
CscoreGO is the confidence score of predicted GO terms. CscoreGO values range in between [0-1]; where a higher value indicates a better confidence in predicting the function using the template.
(b)
The graph shows the predicted terms within the Gene Ontology hierachy for Molecular Function. Confidently predicted terms are color coded by CscoreGO:
Download full result of the above consensus prediction.
Click the graph to show a high resolution version.
(a)
CscoreGO is the confidence score of predicted GO terms. CscoreGO values range in between [0-1]; where a higher value indicates a better confidence in predicting the function using the template.
(b)
The graph shows the predicted terms within the Gene Ontology hierachy for Biological Process. Confidently predicted terms are color coded by CscoreGO:
Download full result of the above consensus prediction.
Click the graph to show a high resolution version.
(a)
CscoreGO is the confidence score of predicted GO terms. CscoreGO values range in between [0-1]; where a higher value indicates a better confidence in predicting the function using the template.
(b)
The graph shows the predicted terms within the Gene Ontology hierachy for Cellular Component. Confidently predicted terms are color coded by CscoreGO:
Click on the radio buttons to visualize predicted active site residues.
(a)
CscoreEC is the confidence score for the Enzyme Commission (EC) number prediction. CscoreEC values range in between [0-1]; where a higher score indicates a more reliable EC number prediction.
(b)
TM-score is a measure of global structural similarity between query and template protein.
(c)
RMSDa is the RMSD between residues that are structurally aligned by TM-align.
(d)
IDENa is the percentage sequence identity in the structurally aligned region.
(e)
Cov. represents the coverage of global structural alignment and is equal to the number of structurally aligned residues divided by length of the query protein.
Click on the radio buttons to visualize predicted binding site and residues.
(a)
CscoreLB is the confidence score of predicted binding site. CscoreLB values range in between [0-1]; where a higher score indicates a more reliable ligand-binding site prediction.
(b)
BS-score is a measure of local similarity (sequence & structure) between template binding site and predicted binding site in the query structure. Based on large scale benchmarking analysis, we have observed that a BS-score >1 reflects a significant local match between the predicted and template binding site.
(c)
TM-score is a measure of global structural similarity between query and template protein.
(d)
RMSDa the RMSD between residues that are structurally aligned by TM-align.
(e)
IDENa is the percentage sequence identity in the structurally aligned region.
(f)
Cov. represents the coverage of global structural alignment and is equal to the number of structurally aligned residues divided by length of the query protein.
[Click result.zip
to download all results on this page]
References:
1.
Wei Zheng, Chengxin Zhang, Yang Li, Robin Pearce, Eric W. Bell, Yang Zhang. Folding non-homology proteins by coupling deep-learning contact maps with I-TASSER assembly simulations. In preparation, 2020.