| What is DEMO-EM? |
| How does DEMO-EM generate multi-domain protein structure predictions? |
In the second step, the model of each inividual domain (or the full-length protein if it is predicted as a signle-domain protein by FUpred) is generated by I-TASSER, which also can be locally installed.
In the third step, each of the individual domain models is independently fit into the density map by quasi-Newton searching to create initial full-length models.
In the fourth step, the initial full-length models are optimized by a two-round rigid-body replica-exchange Monte Carlo (REMC) simulation to minimize the density correlation score (DCS) between the density map and the full-length model. In the first round, domains are treated as particles where a quick REMC simulation is made to quickly adjust the individual domain positions based on the global model-density correlations. The second round of rigid-body REMC simulation is to fine-tune the domain poses with a more detailed energy force field.
In the fifth step, the lowest DCS model selected from the rigid-body assembly simulations undergoes a flexible assembly with atom-, segment-, and domain-level refinements using REMC simulation guided by the DCS and DomainDist predicted inter-domain distance profiles coupled with a knowledge-based force field, with the resulting decoy conformations clustered by SPICKER to obtain a centroid model.
In the last setp, the flexible assembly simulation is performed again for the full-atomic model with constraints from centroid models clustered by SPICKER adding to the energy, and the final model is created from the lowest energy model after side-chain repacking with FASPR and FG-MD.
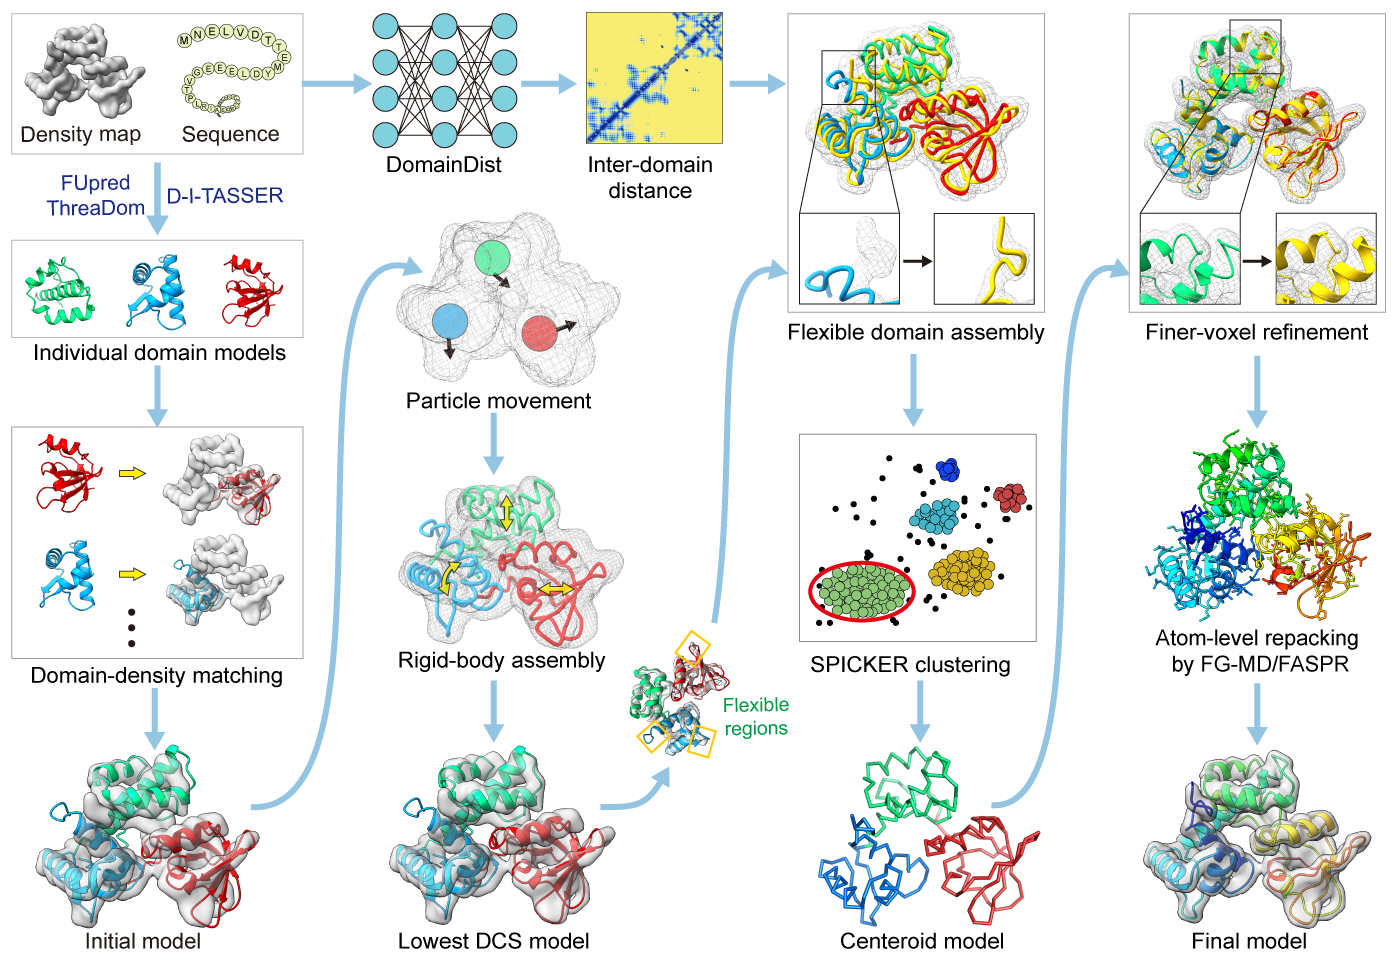
Figure 1. Pipeline of DEMO-EM for multi-domain protein structruces modeling from cryo-EM density maps.
| What are the performances of DEMO-EM server compared with other methods? |
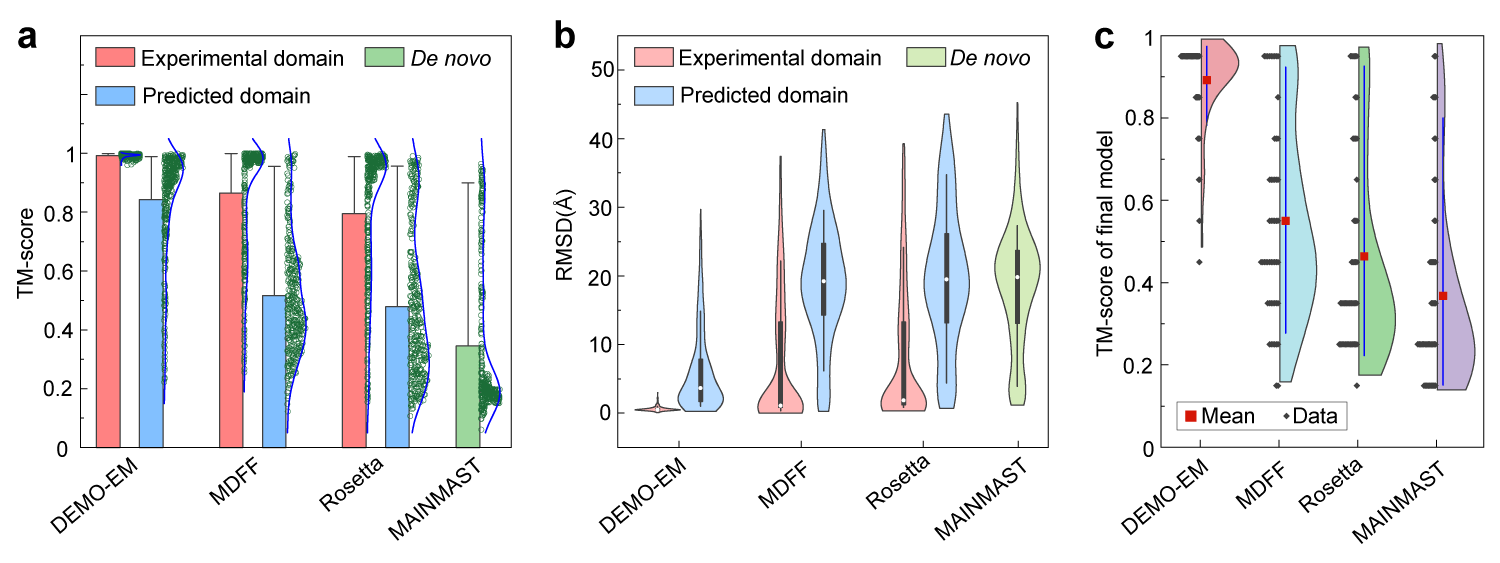
Figure 2. (a) Mean and distribution of TM-score for models by DEMO-EM, MDFF, Rosetta, and MAINMAST using synthesized density maps, respectively. (b) Boxplot and distribution for RMSD of models by DEMO-EM, MDFF, Rosetta, and MAINMAST using synthesized density maps, respectively. (c) TM-score of full-length models constructed by DEMO-EM, MDFF, Rosetta, and MAINMAST using experimental density maps.
| What are the output of the DEMO-EM server if you submit a seqeunce? |
| How to interpret the output data generated by the DEMO-EM server? |
For each target, DEMO-EM reports the top five models ranked by the total energy. Since the top 5 models are ranked by the energy, it is possible that the lower-rank models have a higher CC-score or FSC-score. Although the first model has a higher CC-score or FSC-score and a better quality in most cases, it is not unusual that the lower-rank models have a better quality than the higher-rank models.
CC-score is the correlation and coefficient score between the experimental density and the density probed from a model.
FSC-score measures the normalised cross-correlation coefficient between the experimental volumes and the volumes probed from a model over corresponding shells in Fourier space.
TM-score is a recently proposed scale for measuring the structural similarity between two structures (see Zhang and Skolnick, Scoring function for automated assessment of protein structure template quality, Proteins, 2004 57: 702-710). The purpose of proposing TM-score is to solve the problem of RMSD which is sensitive to the local error. Because RMSD is an average distance of all residue pairs in two structures, a local error (e.g. a misorientation of the tail) will arise a big RMSD value although the global topology is correct. In TM-score, however, the small distance is weighted stronger than the big distance which makes the score insensitive to the local modeling error. A TM-score >0.5 indicates a model of correct topology and a TM-score<0.17 means a random similarity. These cutoff does not depends on the protein length.
Here the "Estimated TM-score" is an estimated value of TM-score over the correlation between TM-score and CC-score/FSC-score which is observed by a nonredundant training set.
| How long does it take for DEMO-EM to generate the predictions for your protein? |
In addition, if you choose to use inter-domain distances predicted by deep learning or structural analogous multi-domain templates to guide the assembly, it will require much extra time to complete the job. Because the mutiple sequence alignment generation needs to detect a huge library, and the multi-domain templates identification needs to evaluate the whole multi-domain library.
However, it will cost less time if you provide the domain models since the program does not need to predict the domain bounaries and domain structruces.
| How to cite DEMO-EM |
| Funding support |
| Contact information |
zhanglab![]() zhanggroup.org
| +65-6601-1241 | Computing 1, 13 Computing Drive, Singapore 117417
zhanggroup.org
| +65-6601-1241 | Computing 1, 13 Computing Drive, Singapore 117417